Distance rings on the map
The map zooms out to show the site and its sources together: rings at 25 to 300 km, epicentres coloured by intensity at the site, and the strongest ones labelled with magnitude, year and intensity.
Platform
Place the sites you need to assess — a plant, a depot, a camp, a launch pad — and see each one's exposure to earthquakes, tsunamis and volcanoes from published hazard maps and public historical catalogues, then its month-by-month climate from reanalysis data. Every event drawn on the real map around the site, every site ranked side by side, every result exportable as a branded PDF report.
Earthquake
The site's reference shaking comes from the GSHAP global hazard map — the 475-year peak ground acceleration, with its published hazard class. Around it, every recorded earthquake from the USGS catalogue since 1900 within the chosen radius, each with the intensity it would have produced at the site: the USGS ShakeMap where one exists for the strongest events, otherwise the Allen, Wald & Worden (2012) equation with its ±1σ range — and an explicit flag when an event falls outside that equation's validity domain.
The map zooms out to show the site and its sources together: rings at 25 to 300 km, epicentres coloured by intensity at the site, and the strongest ones labelled with magnitude, year and intensity.
A magnitude 9 at 100 km and a magnitude 6 next door do not shake a site the same way. Every event is turned into the intensity the site itself would have felt, with the count of damaging events summarised up front.
Instrumental catalogues only start around 1900, and older or smaller events are incomplete. The panel and the report both say so: a short history is never presented as proof of low hazard.
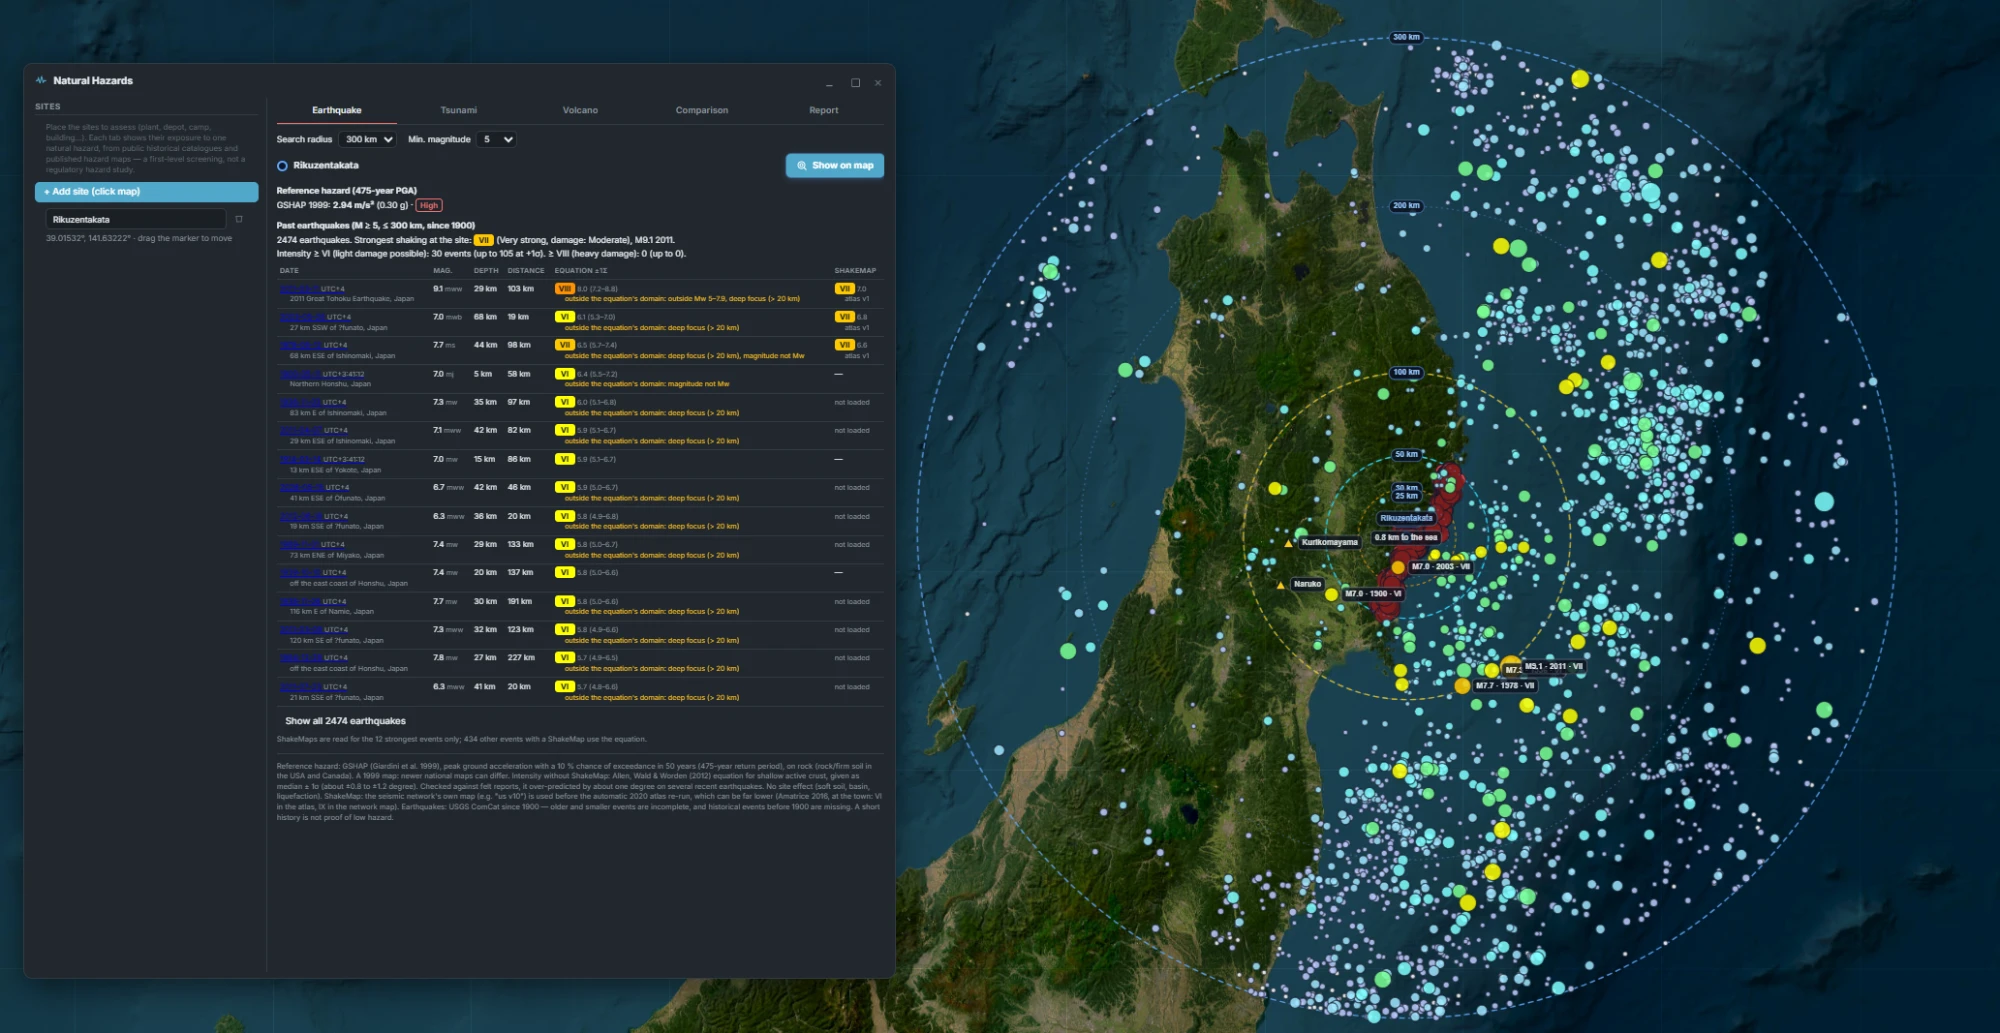
Earthquake · Rikuzentakata, Japan — 2,474 events within 300 km, the 2011 M9.1 among them
Tsunami
A comparison, not a simulation. The site's ground elevation and its distance to the sea come from the Copernicus GLO-90 elevation model; around it, every tsunami observation in NOAA's Global Historical Tsunami Database within 25, 50 or 100 km. The site is compared with the highest reliable wave height recorded nearby, with a 4 m margin for the elevation model's own vertical accuracy — and with the farthest inland reach ever recorded.
Doubtful events, seiches, meteorological and atmospheric waves, and deep-ocean gauge readings are listed but never used as the reference. Unreliable observations stay visible on the map as hollow markers, so nothing is hidden.
The nearest stretch of sea is traced from the site and labelled with its distance; every observation is plotted and coloured by water height, with its source event, cause and measurement type in the table.
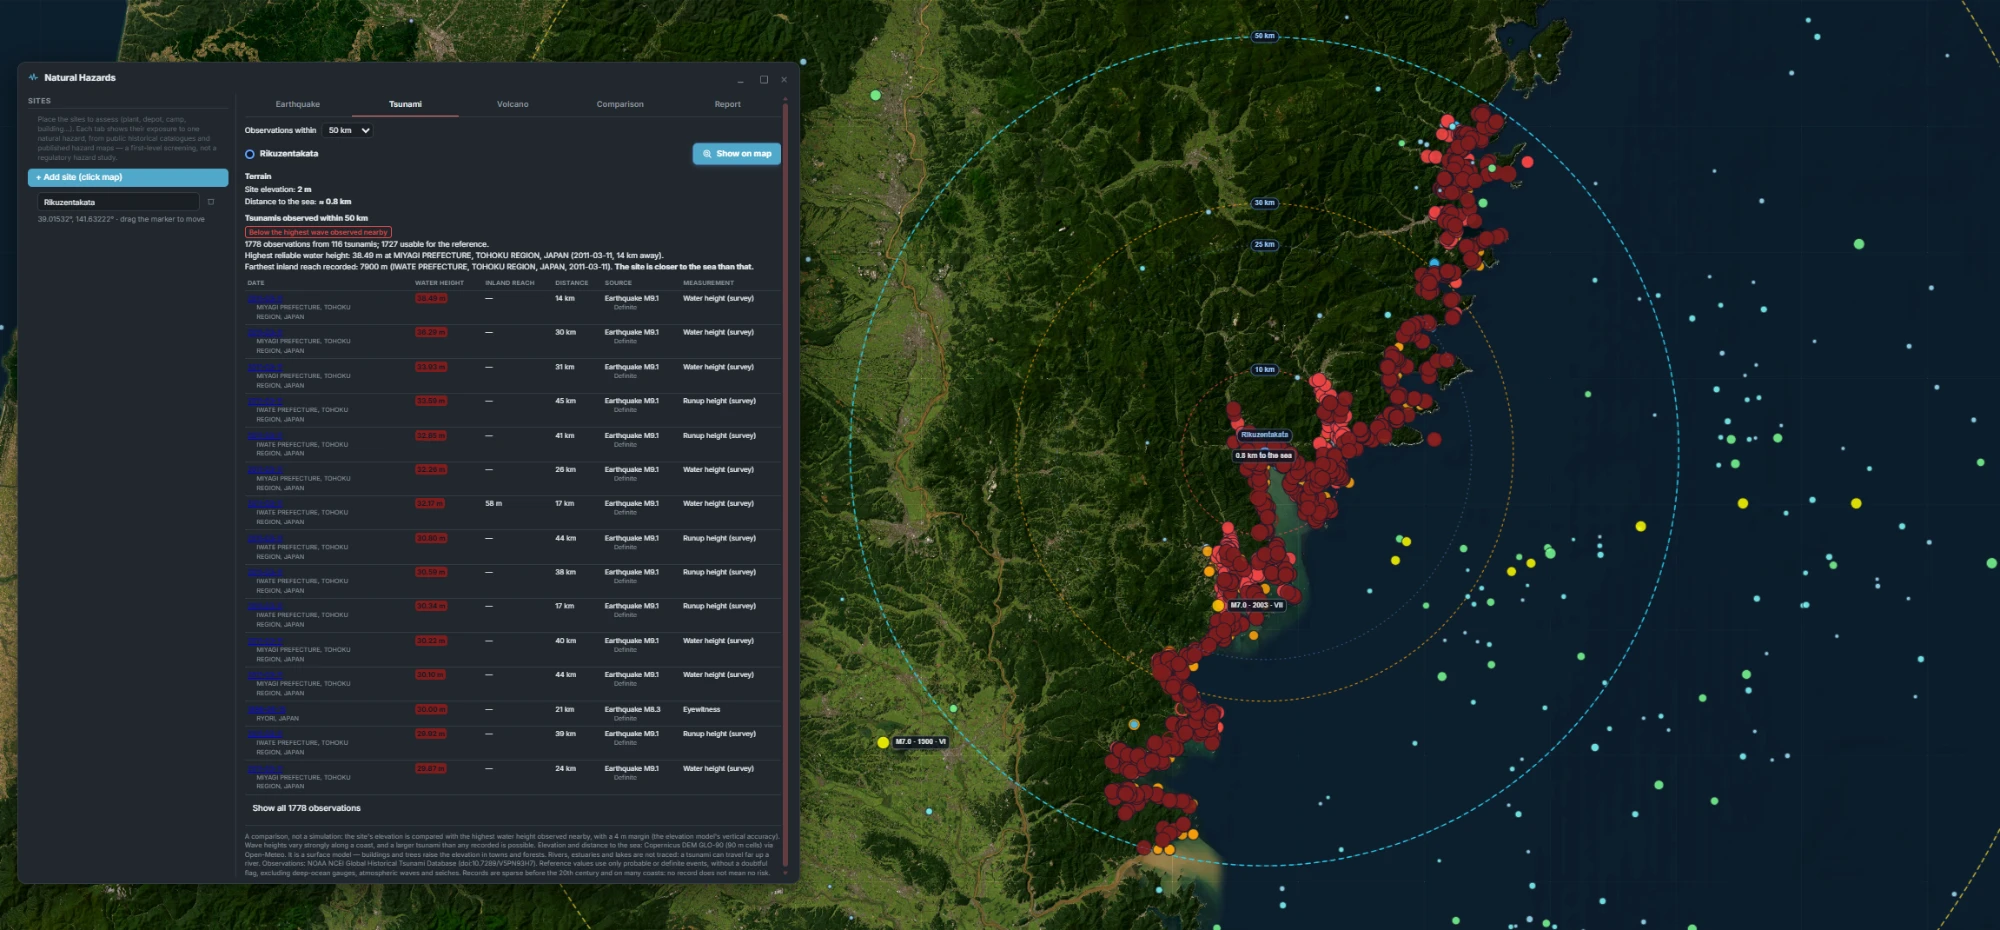
Tsunami · Rikuzentakata — 2 m above sea level, below the 38.5 m observed in 2011
Volcano
Volcano locations from NOAA's database, compiled from the Smithsonian Global Volcanism Program, sorted into the distance rings used in published volcanic-risk studies (Brown et al. 2015; Biass, Jenkins et al. 2024): within 10 km, most effects of moderate eruptions; up to 30 km, the lethal reach of larger ones; up to 100 km, ash fall and lahars that follow valleys. Each volcano comes with its last eruption, its significant eruptions from NOAA's catalogue, the largest explosivity index recorded and the deaths and their causes.
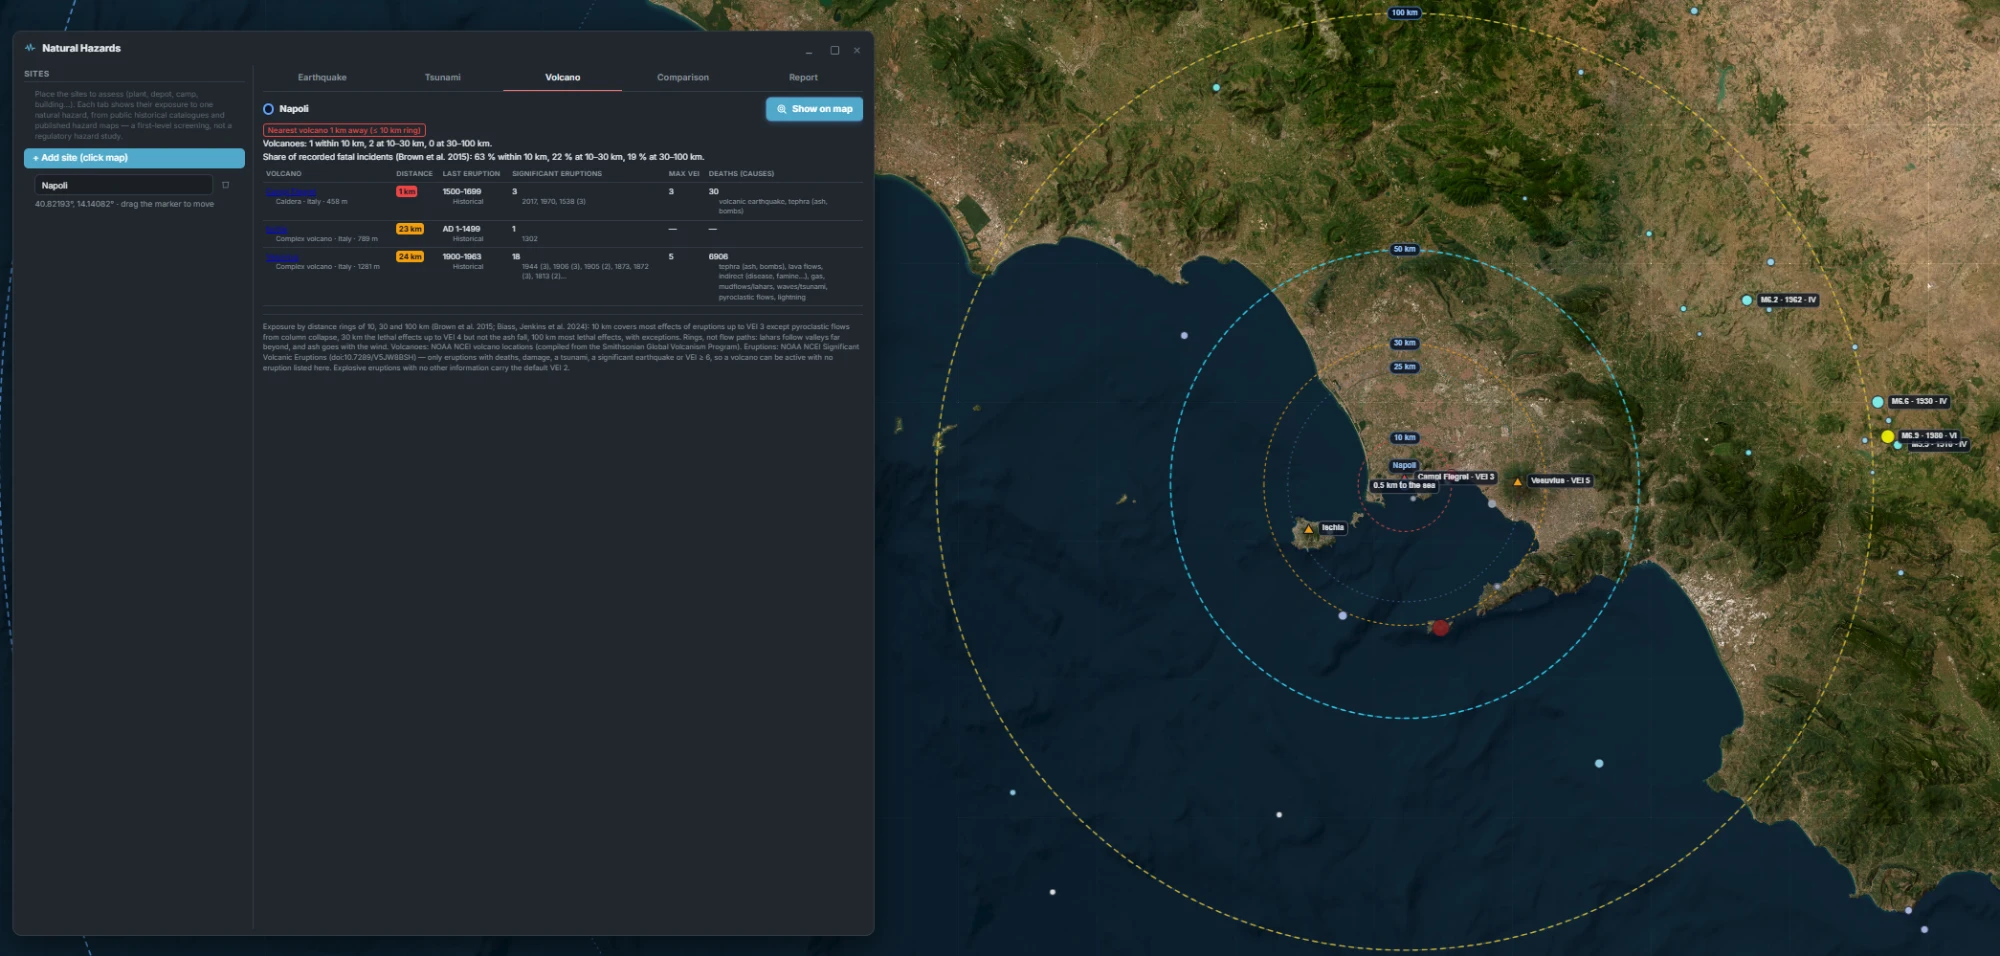
Volcano · Naples — Campi Flegrei 1 km away, Ischia and Vesuvius in the 30 km ring
Comparison & report
An earthquake, a tsunami and a volcano are not comparable in frequency or effect, so SatView never blends them into a weighted score. Each hazard gets a level from a published threshold — the GSHAP hazard class, the tsunami verdict, the volcano's distance ring — and sites are ranked by their worst level, then the next. A hazard with no reference data is shown as unknown and never read as low.
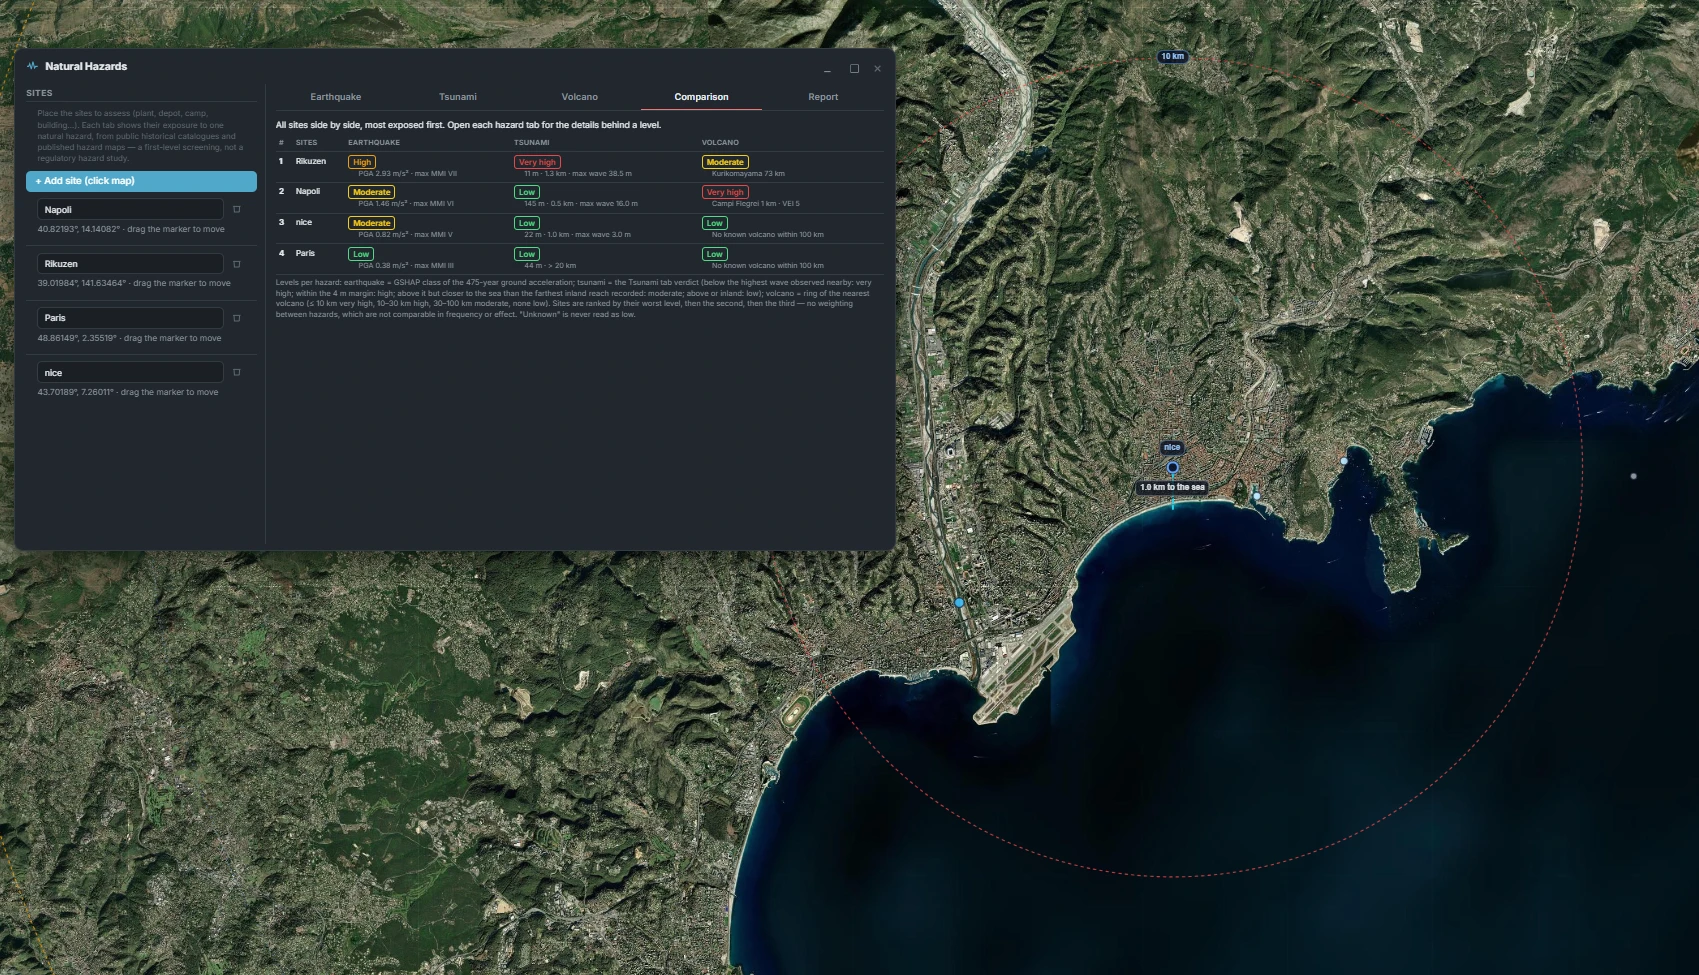
Comparison · four sites ranked worst level first — Rikuzentakata, Naples, Nice, Paris
The branded PDF opens with the map and the comparison table, then gives every site's full detail per hazard — reference hazard, past events, observations and volcanoes — and ends with every source and every limitation, word for word as the panel shows them.
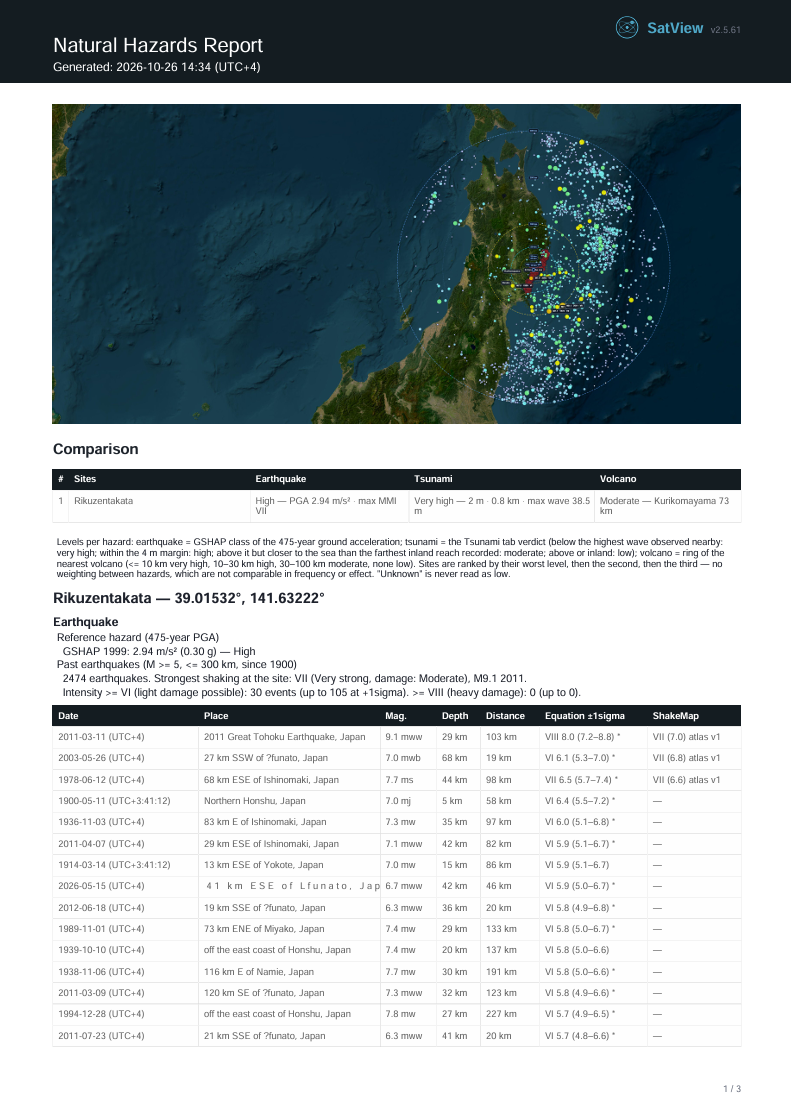
Natural Hazards report · page 1
Weather & climate
Site climatology from the ERA5 reanalysis — ten years of history by default, reduced to a monthly table: wind and gusts, precipitation as a real monthly total with its number of wet days, cloud cover, and wave height and period for coastal sites. An annual row and the most extreme months come with it, in the same resizable window and branded PDF report as the rest of the platform.
Which months are windiest, wettest or roughest at sea — for a campaign, a launch window, a construction schedule or an offshore operation — read from years of reanalysis rather than a week of forecasts.
Click the map to add as many locations as you need, rename them, and switch between them; each one's climatology is computed once and kept for the report.
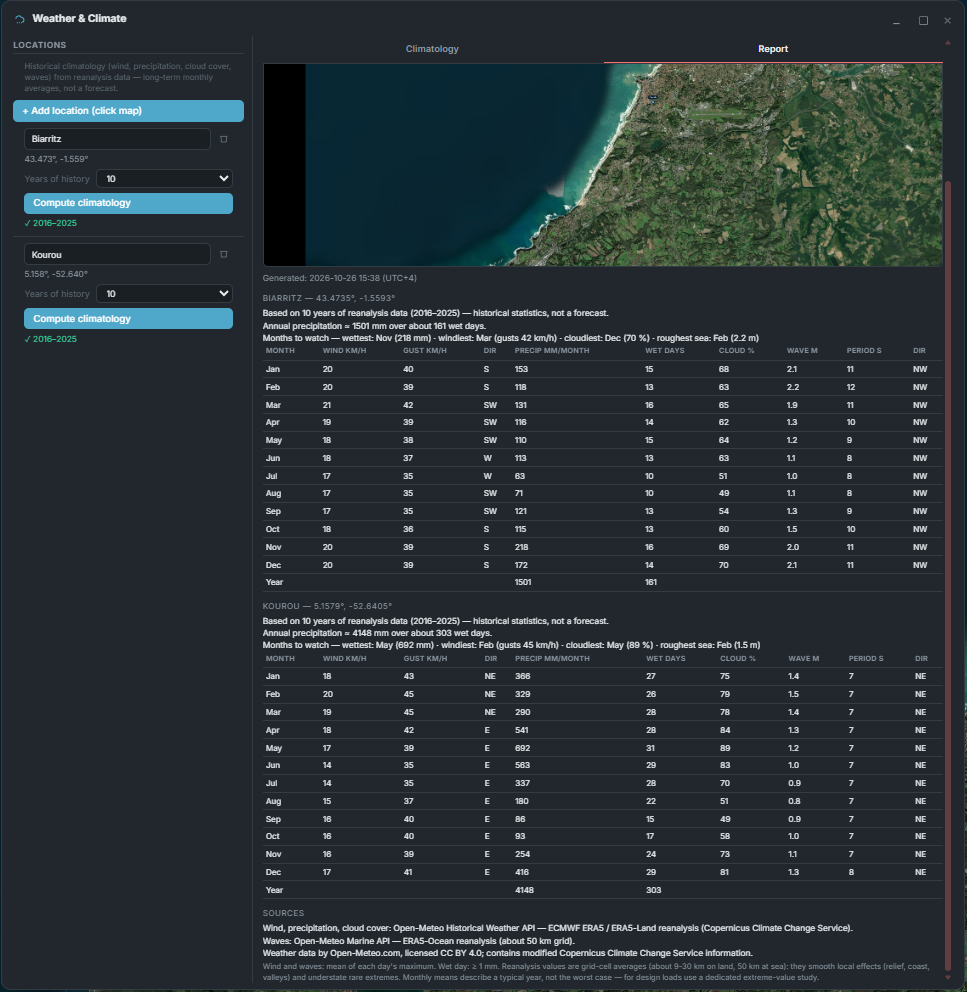
Weather & Climate · Biarritz and Kourou, ten years of ERA5 (2016–2025)
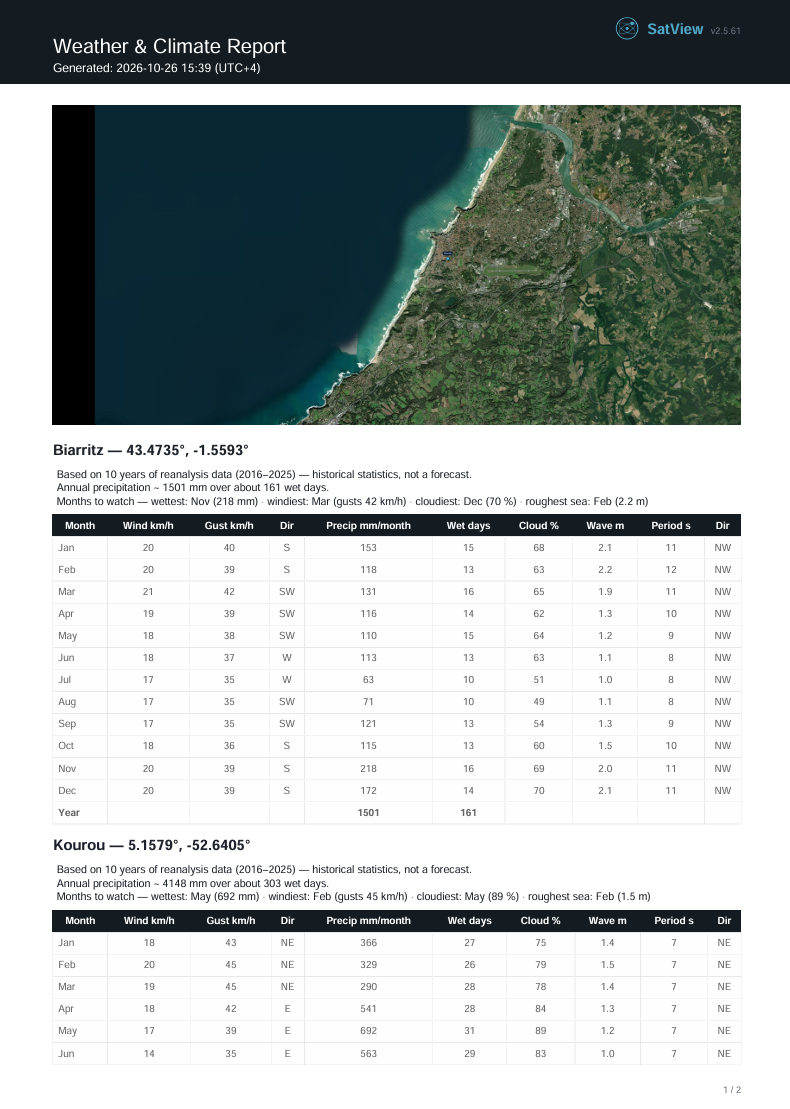
Weather & Climate report · page 1
Earthquake, tsunami, volcano and climate for every candidate site, in one window and one report — on your own infrastructure.
Tell us about your mission — we will get back to you.