How much a launcher puts into orbit from a given site, found by trajectory optimisation rather than
read off a curve: a 3-D flight simulation from lift-off to final orbit, guidance optimised up to
direct optimal control, parking orbits and restarts, the site's own upper-air winds, Monte-Carlo
dispersions and where every stage falls. The same engine feeds the multi-site
Launch Site Study, so every site is compared on a payload
actually flown.
Launch performance
Trajectory optimisation, checked against published benchmarks
The ascent engine behind the study uses the methods of the reference trajectory tools: a 3-D
simulation from lift-off to final orbit, direct optimal control in the discrete-parameter
formulation of NASA's POST, solved by sequential quadratic programming, multi-burn missions flown
with finite burns, upper-air winds and Monte-Carlo dispersions. Every payload it gives is a
mission the simulator actually flew, and every method is recomputed live against public
reference cases.
+0.11 %
Final mass vs the published multiple-stage ascent benchmark
10-7
Five target orbital elements met
3
Guidance modes, up to optimal control
5
Public reference cases recomputed in the app
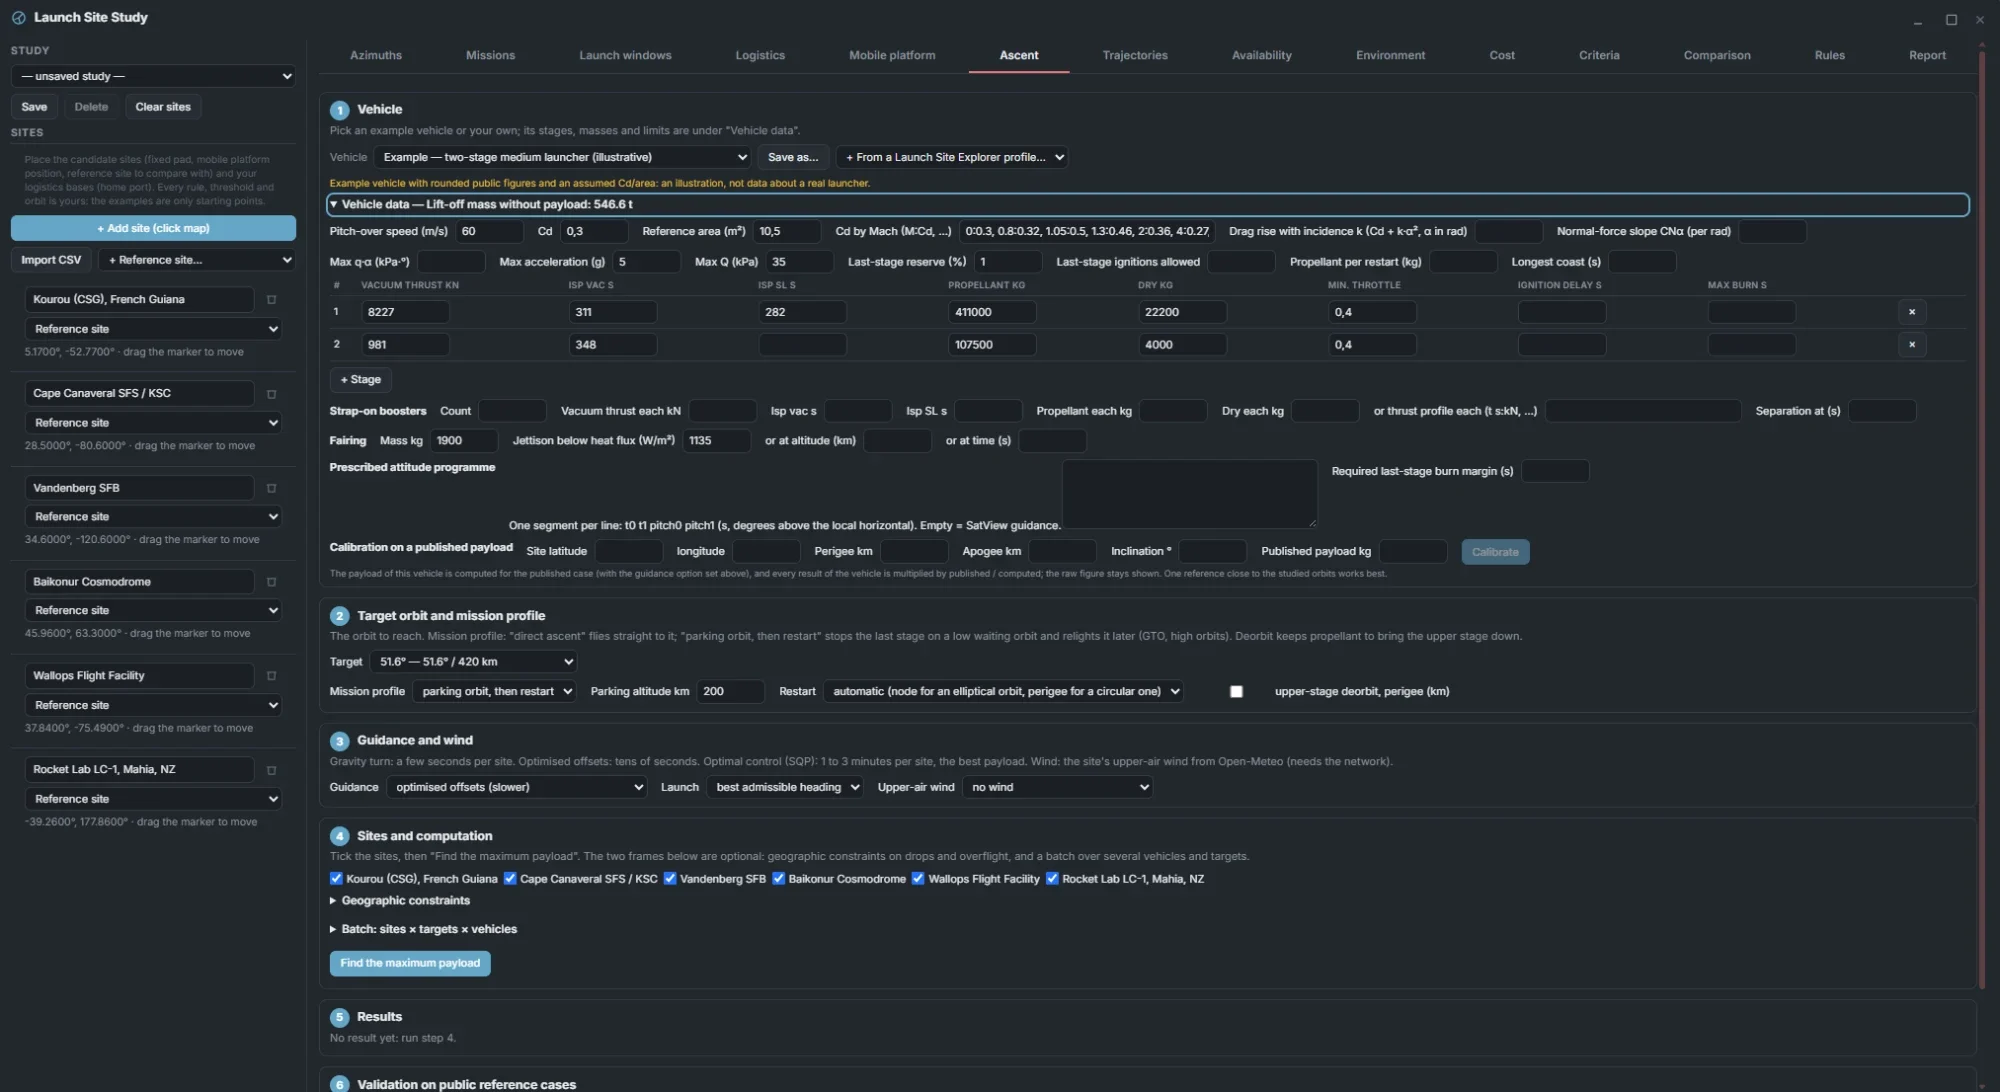
Ascent tab · six numbered steps, from the vehicle to the validation on public cases
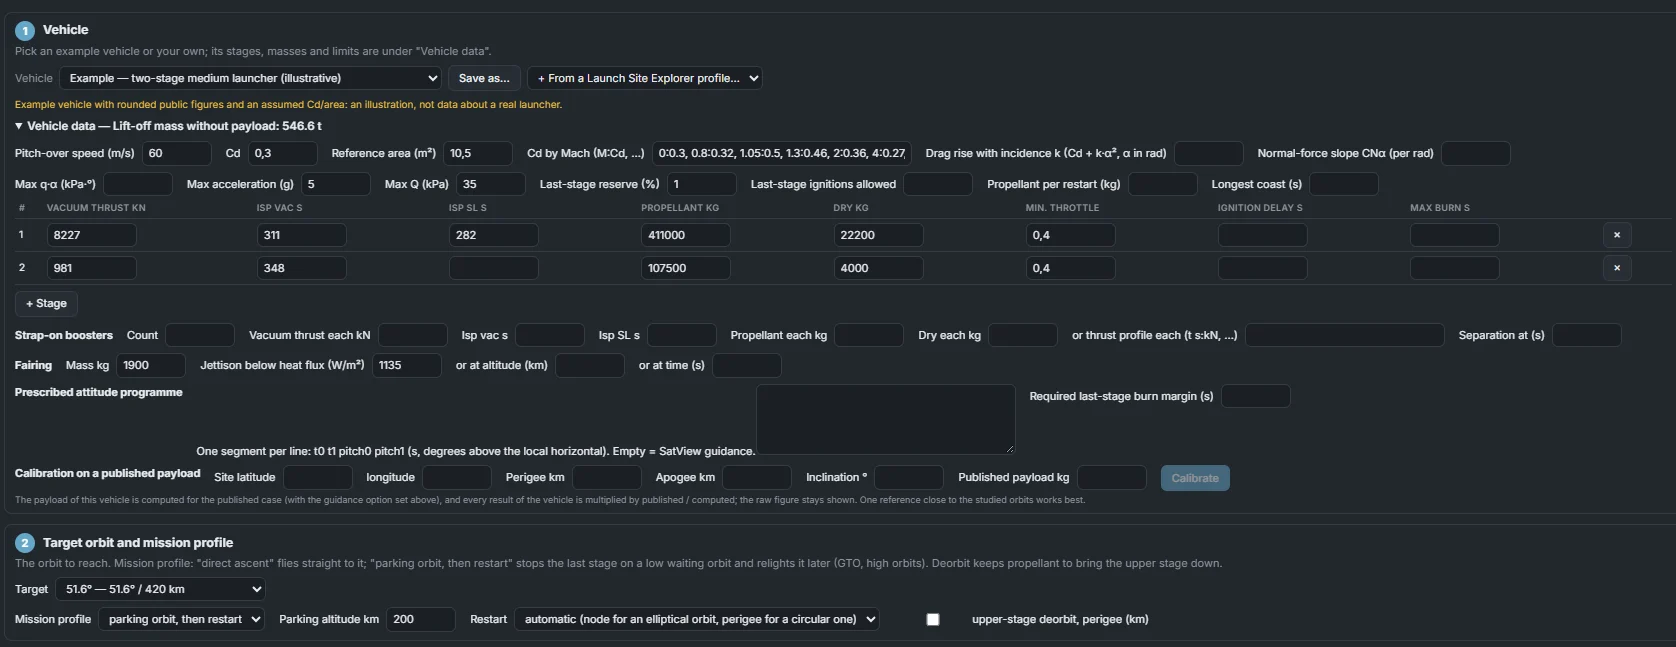
A complete vehicle model
3-D point mass on a rotating Earth with J2, J3 and J4 gravity and the US 1976 atmosphere.
Mach-dependent drag, strap-on boosters with tabulated thrust, fairing jettisoned on heat flux,
hold-down until thrust exceeds weight, ignition delays and burn limits, max-Q and max-g
throttling down to a minimum throttle, last-stage reserve and required burn margin. Circular,
elliptical and GTO targets.
Optimal control by SQP
The payload is a decision variable, maximised over the kick angle, the heading, the thrust
elevation and yaw at nodes along the upper-stage burns and the cut-off time, under the injection
constraints. KKT steps, damped BFGS, active-set bounds, merit and filter acceptance,
second-order correction, feasibility restoration and several starting points. A gravity turn
and an offset optimiser run alongside; the better result is kept, and the row says which.
Multi-burn missions
Direct ascent, or a parking orbit and a restart: a coast to the equatorial crossing for a GTO,
to the perigee for a circular orbit, or for a set time, then the transfer burn and the
circularisation. Ignitions allowed, propellant per restart and longest coast are vehicle limits.
An optional upper-stage deorbit burn is taken off the payload. Optimal control covers these
missions too, with the later burns flown as finite burns.
Upper-air winds and loads
Each site's wind profile on 12 pressure levels up to 24 km, from a full year of hourly
data: annual mean, a month's mean or a month's strong wind (95th percentile) for the loads. The
vehicle takes the wind as incidence; q·α is reported for every result and can be limited, with
optional normal-force and incidence-drag coefficients. Jettisoned bodies fall in the same wind.
Dispersions and public safety
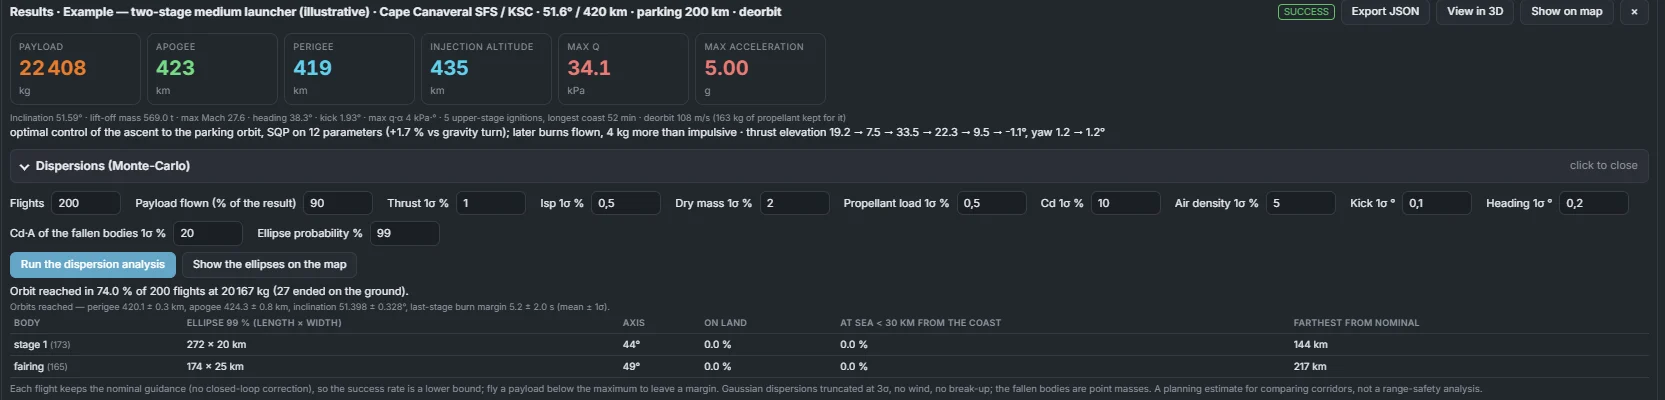
Monte-Carlo on thrust, Isp, masses, propellant load, drag, air density, kick, heading and the
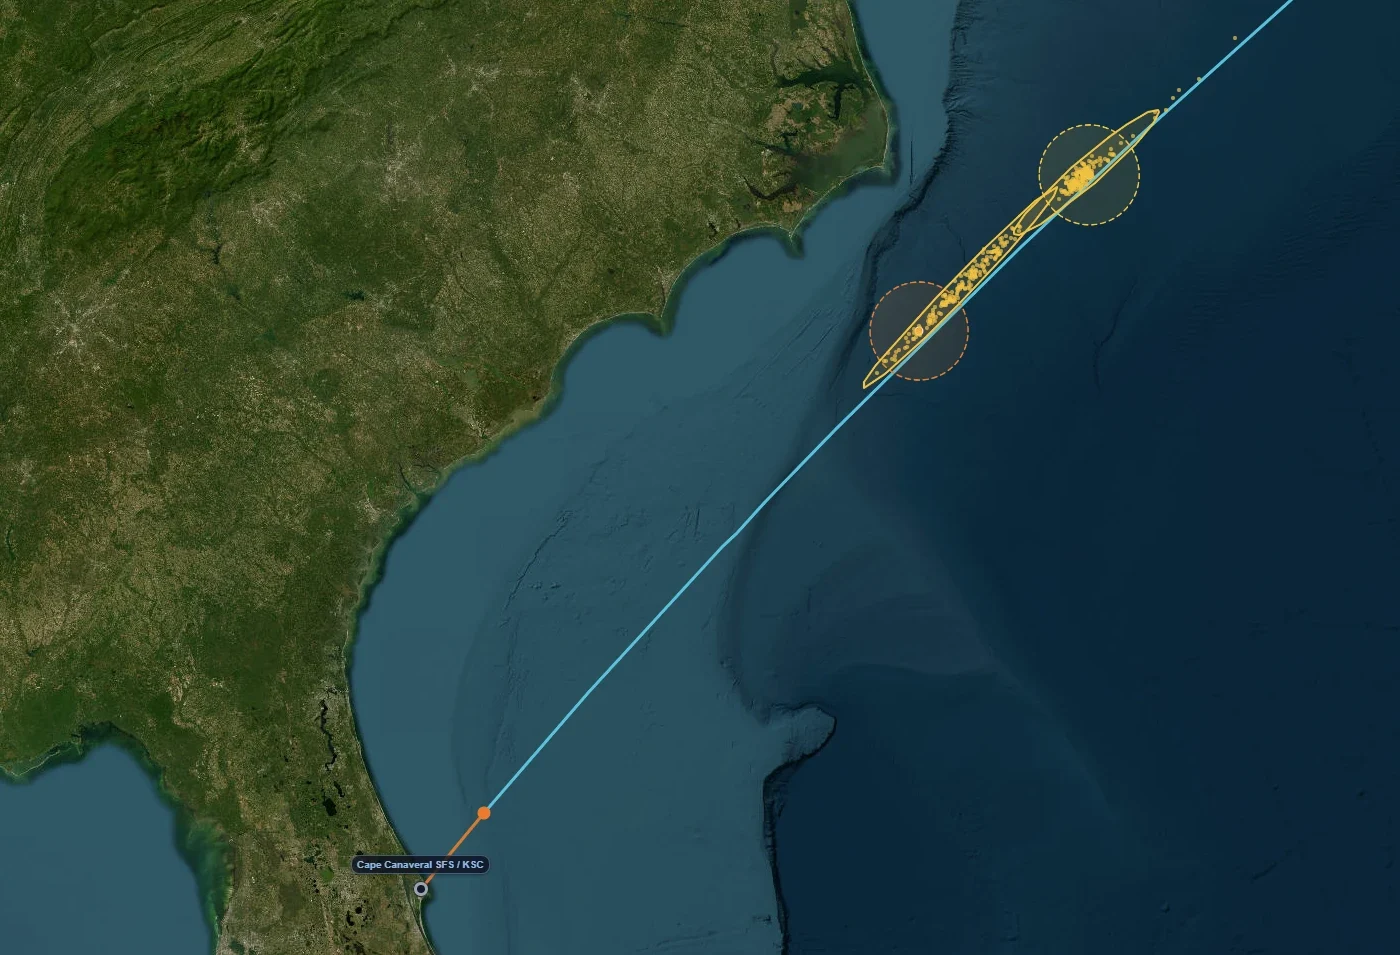
fallen bodies' Cd·A: success rate, orbit statistics and an impact ellipse per jettisoned body,
with its share on land. Expected casualties per flight against the 10-4 public
collective-risk reference of FAA 14 CFR 450.101. Drops at sea a chosen distance from
any coast are enforced by steering the trajectory itself.
Studies at scale
Planes below the site latitude solved by the better of a dogleg and an in-orbit plane change.
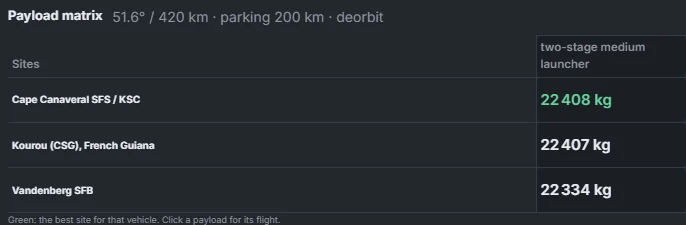
Batch runs over sites × targets × vehicles with a payload matrix and CSV export, several sites
computed in parallel. Calibration of a vehicle on one published payload, velocity-loss
breakdown and C3, JSON export of every run, and trajectories imported from any other tool
screened the same way.
From the vehicle to the payload
Vehicle data and mission profile · stages, limits, fairing, boosters, parking orbit and restart
Results · one row per site, the method kept and why, ignitions, coasts and deorbit
Every result is a flown mission
Lift-off
Max Q
Boosters
Fairing
Staging
Parking coast
Restart
Circularisation
Deorbit
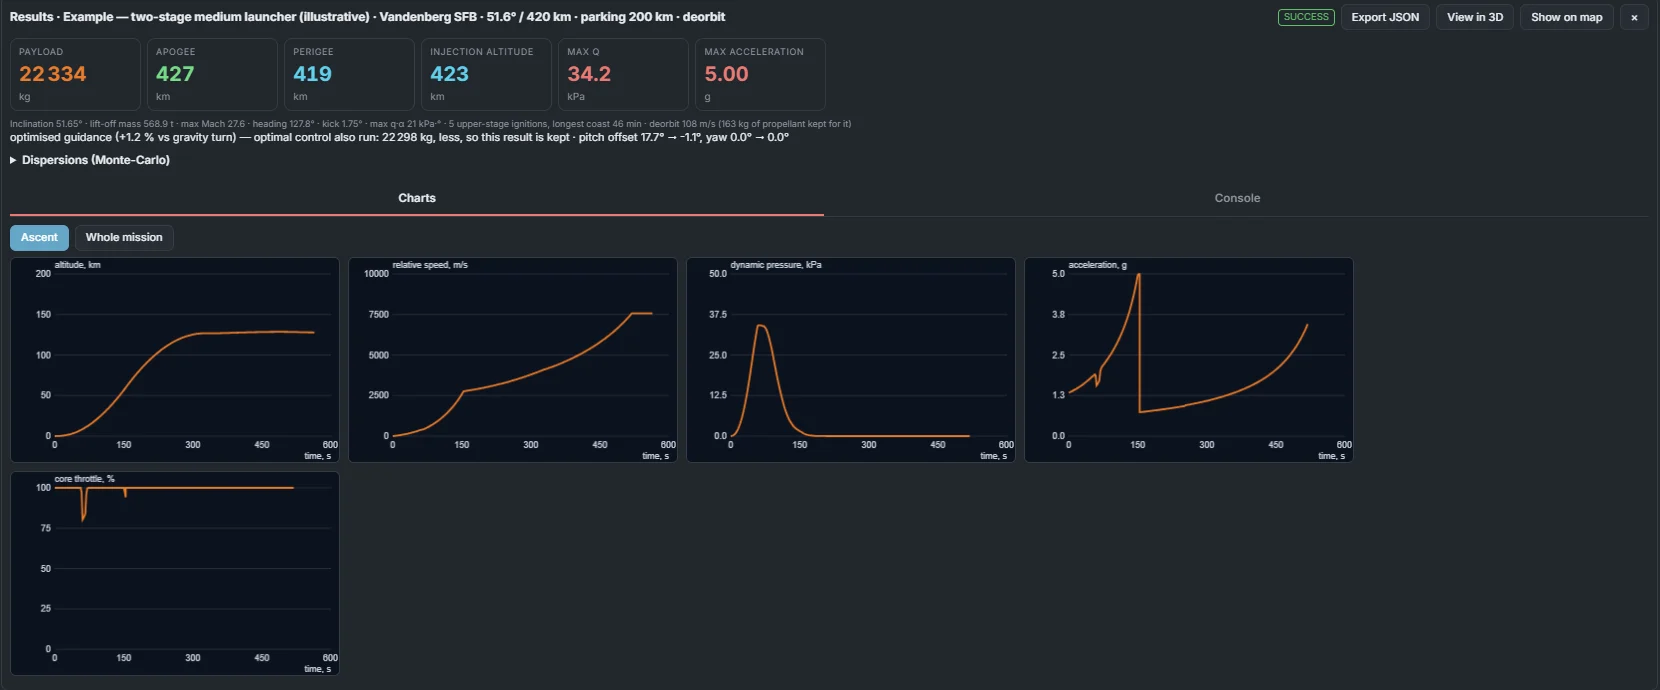
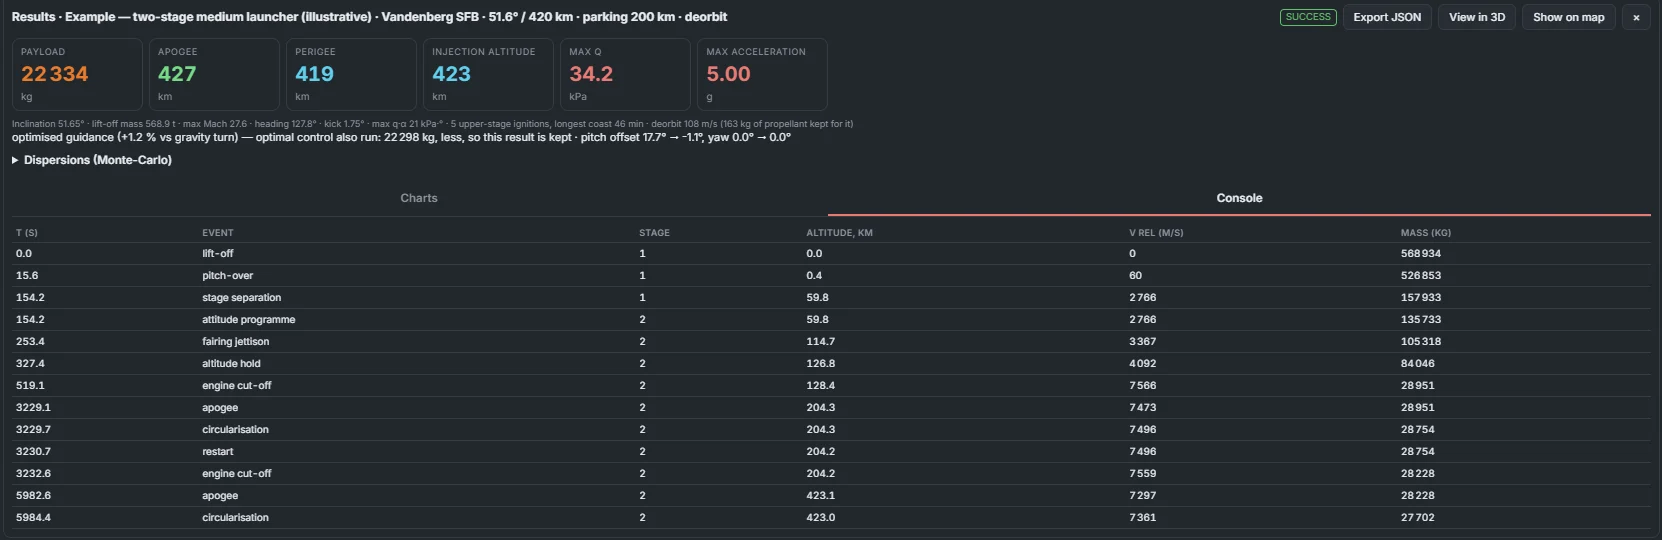
Event console, altitude, speed, dynamic pressure, acceleration and throttle charts, and the drop point of
every jettisoned body on the map.
Result detail · headline figures and the ascent charts, or the whole mission
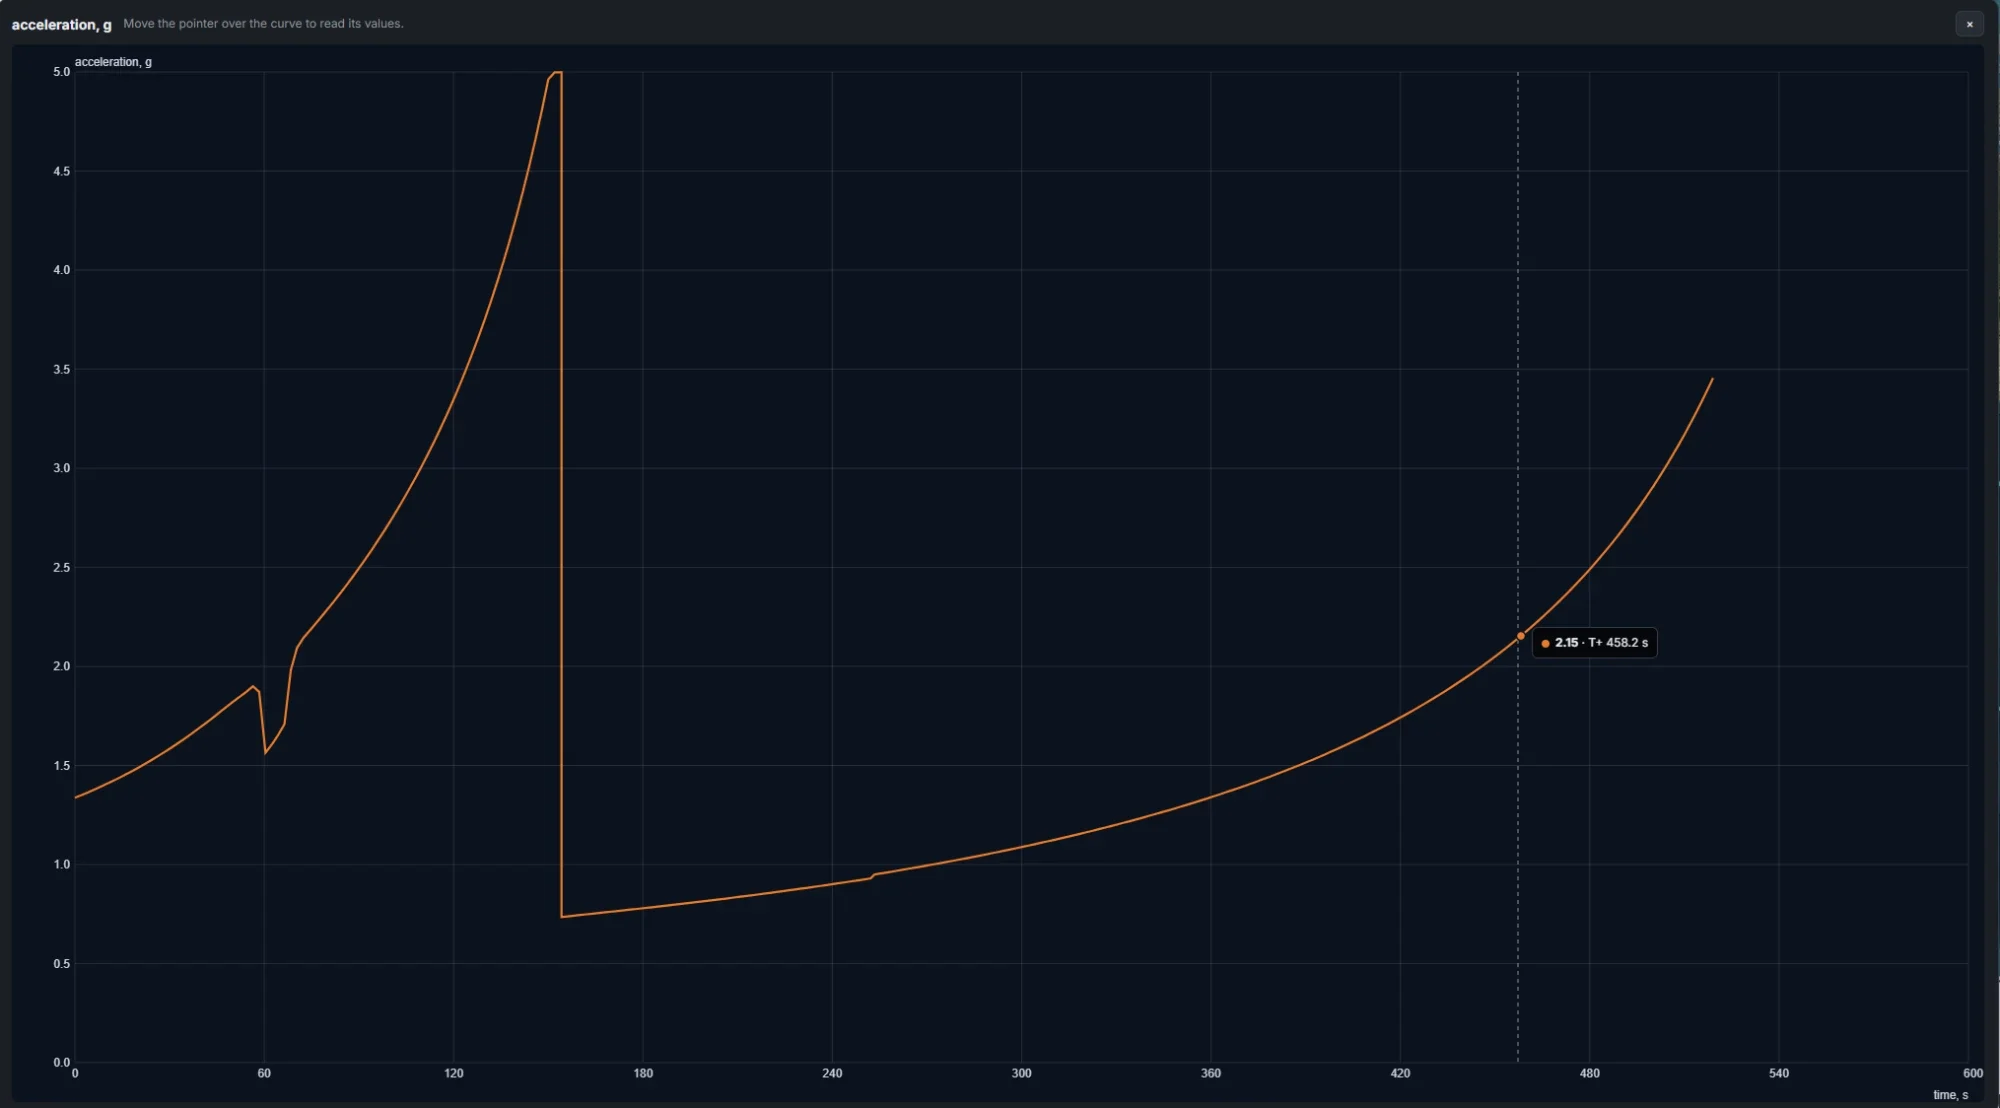
Any chart enlarged, with the value under the cursor
Event console · every event with its time, altitude, speed and mass
The flight in 3-D
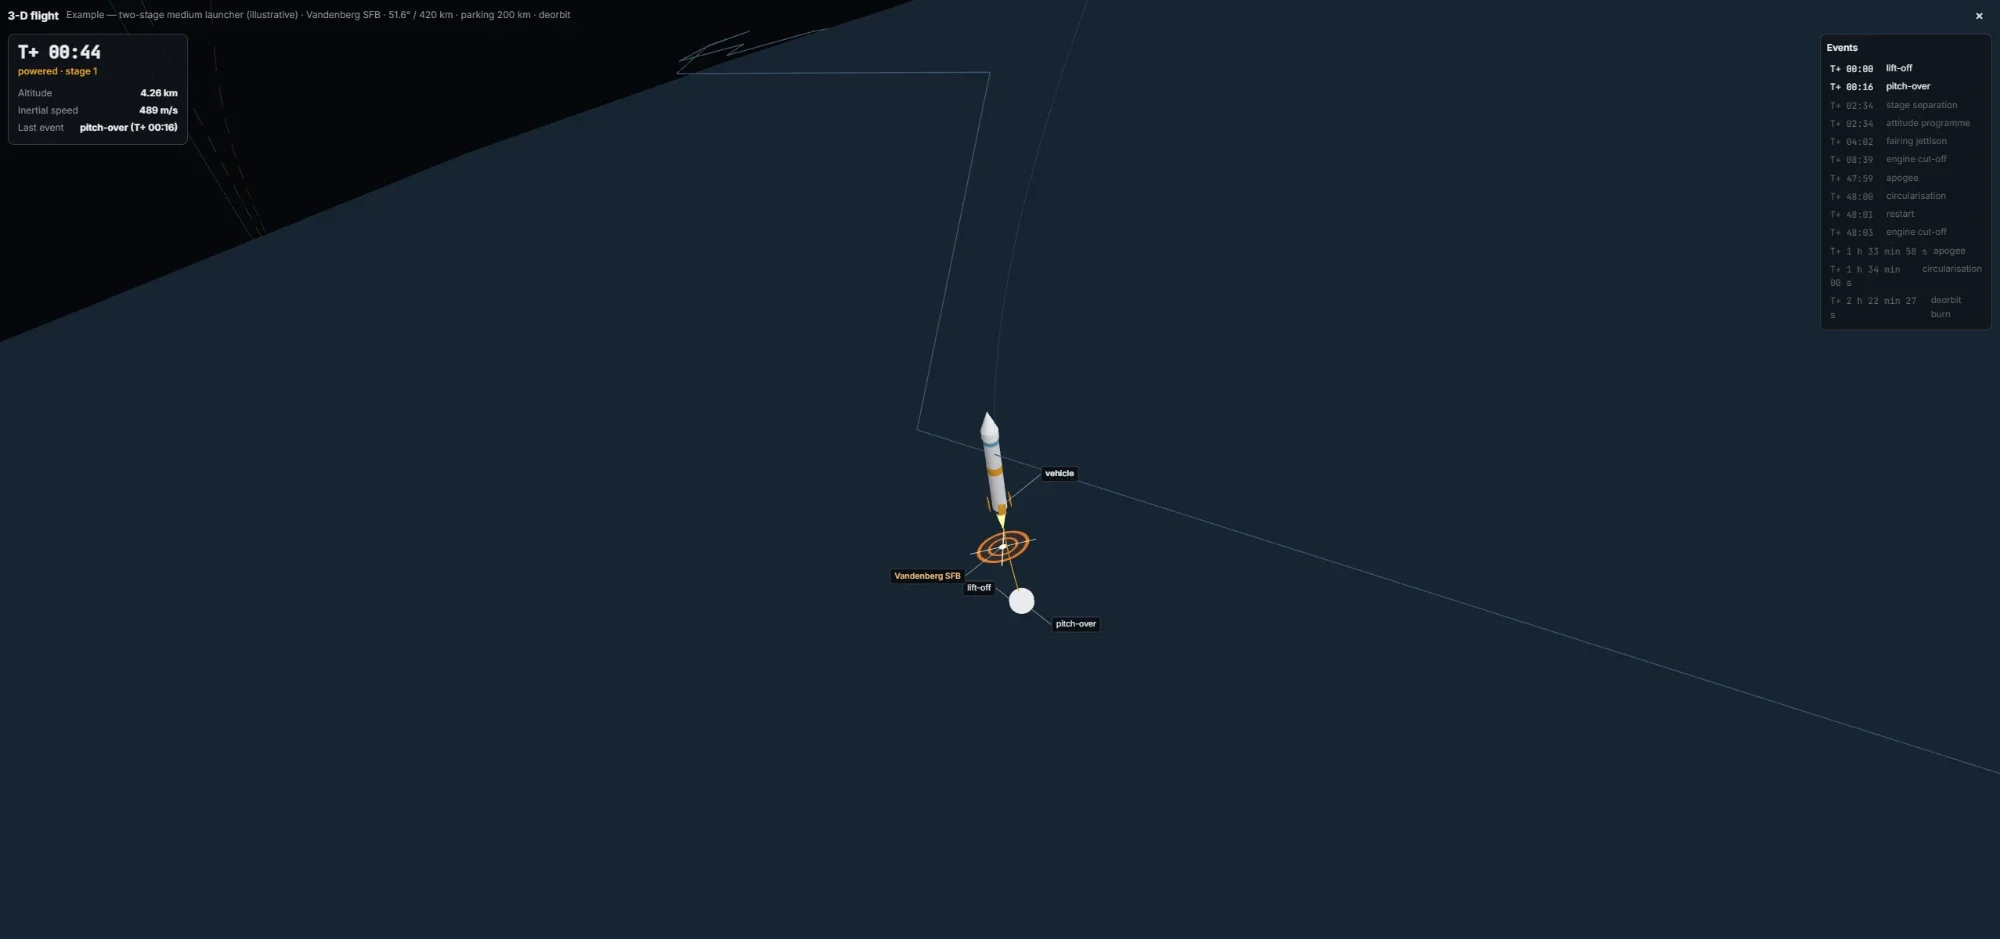
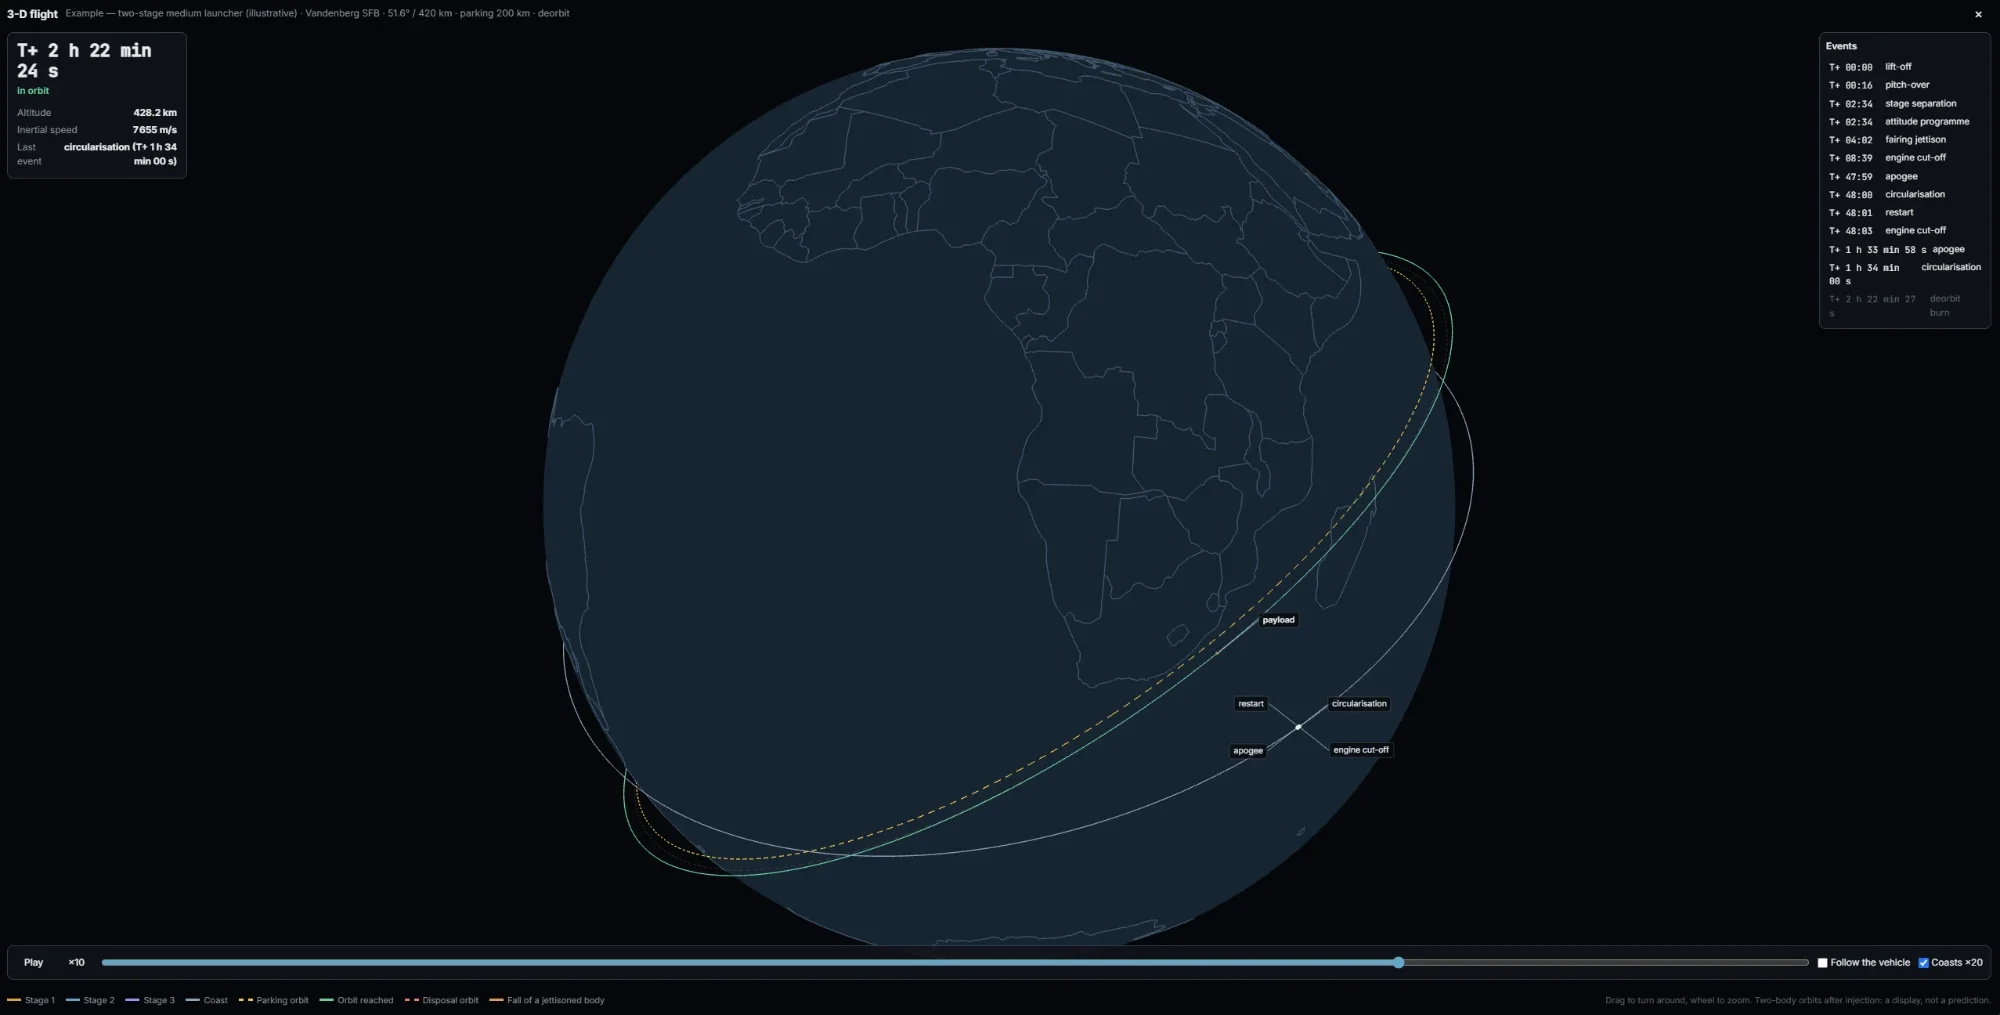
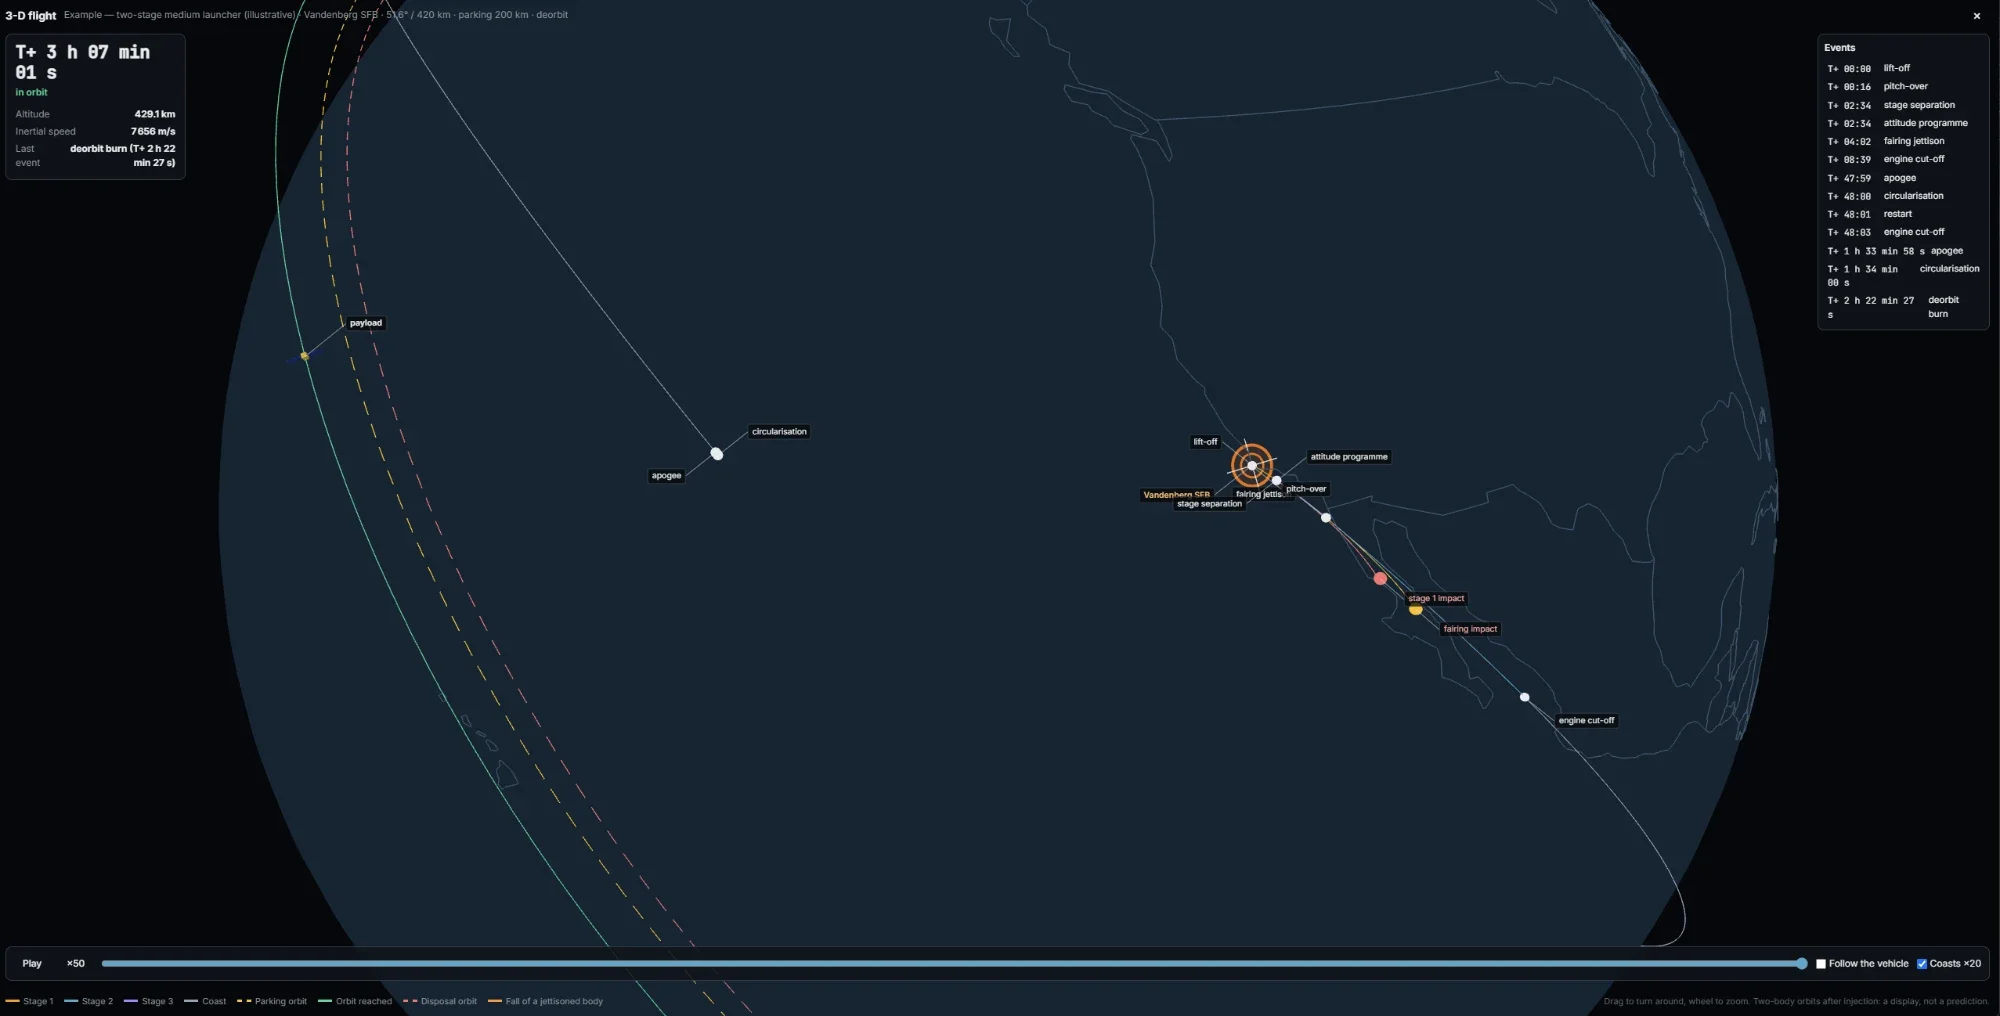
Any result replays on a globe you can turn around: the vehicle and its stages, each
separation and jettison, the fall of every jettisoned body to its impact point, and the parking, reached
and disposal orbits, with a live readout and a jump list of the events.
A whole launch in 3-D, from lift-off to the orbit reached · a real screen recording of SatView, nothing staged: every frame is drawn from the trajectory the application computed from the vehicle, mission, guidance and site parameters
Lift-off above the launch site
Parking orbit, restart and the orbit reached
The ascent, the stage 1 and fairing impacts, and the disposal orbit
Dispersions and drop zones
Dispersions · success rate, orbit statistics and a 99 % impact ellipse per jettisoned body
The impact ellipses on the map, at sea off the coast
Sites × vehicles in one run
Payload matrix · one column per vehicle, the best site in green, a click opens the flight
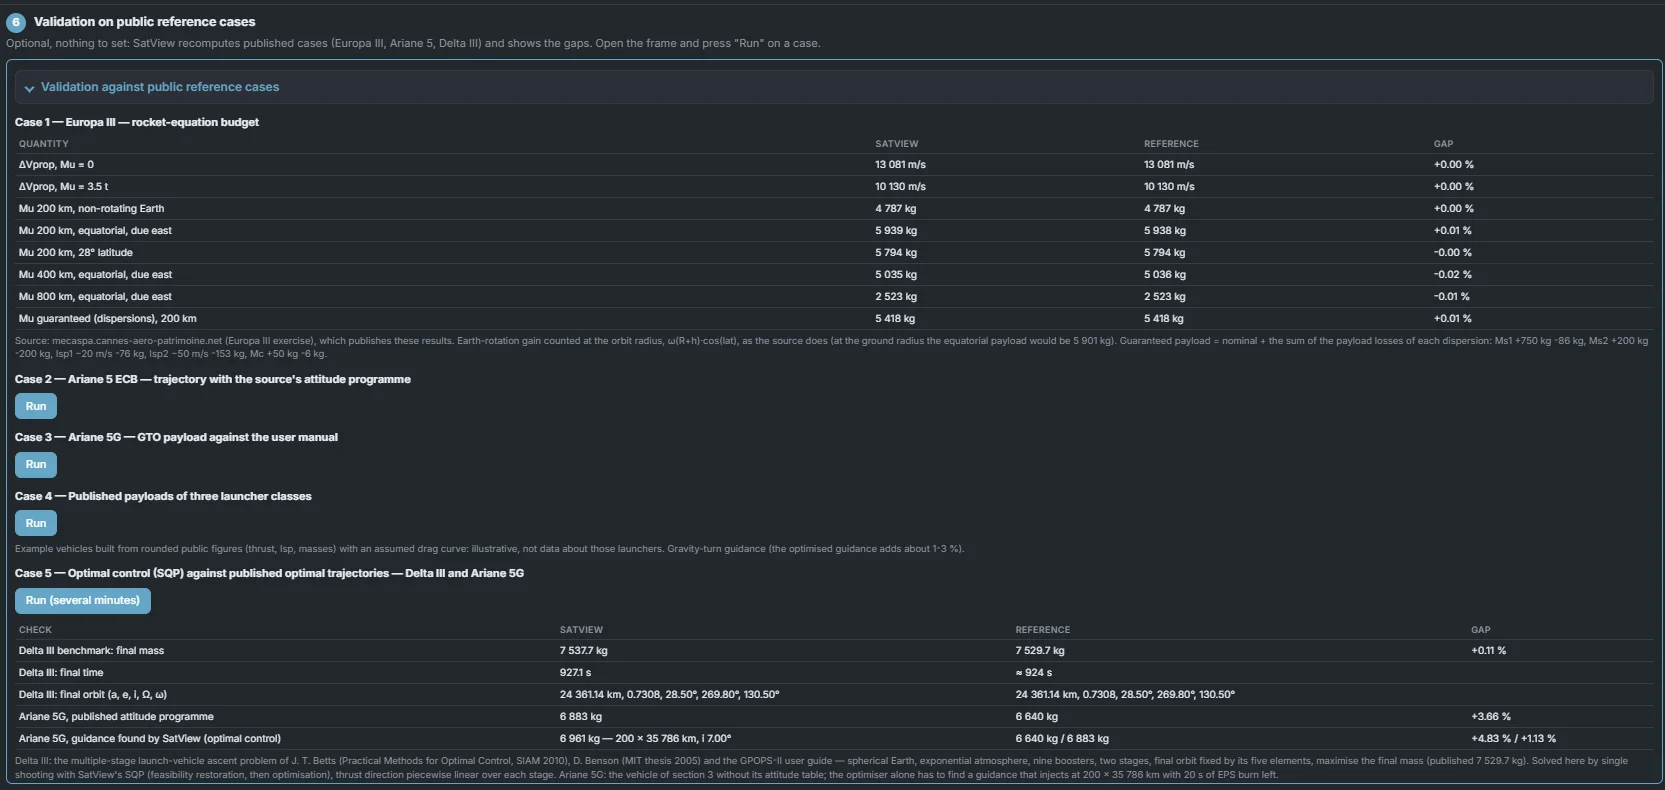
Validation on public reference cases
Case
Published
SatView
Gap
Multiple-stage ascent benchmark, Delta III class (Betts 2010, Benson 2005, GPOPS-II), solved by SatView's SQP
7 529.7 kg final mass
7 537.7 kg, final time 927 s (≈ 924 s)
+0.11 %
Ariane 5G to GTO, published attitude programme
6 640 kg (user manual)
6 887 kg with 20 s of EPS margin; main stage out at 585 s (589 s), max Q at 66 s (69 s)
+3.7 %
Ariane 5G to GTO, guidance found by the optimiser alone
6 883 kg (published programme)
6 961 kg to 200 × 35 786 km, i 7.00°
+1.1 %
Europa III Δv budget
Published budget
Reproduced
Exact
Ariane 5 ECB project
Chronology, GTO with ≥ 20 s Vinci margin
Chronology and requirement met
—
Launch windows: Sentinel-2A from Kourou, Landsat 9 from Vandenberg
Flown at 01:52 and 18:12 UTC
01:58 and 18:25 UTC
6 and 13 min
Ariane 5 and Europa cases from the published exercises of mecaspa.cannes-aero-patrimoine.net. The first five cases run from the Validation frame of the Ascent tab, so anyone can check them.
Validation frame · the published cases recomputed live, with the gaps
Fast where it can be, thorough where it matters. A gravity turn takes seconds per site,
the offset optimiser tens of seconds, optimal control one to three minutes per site, all in the browser,
in parallel and cancellable. The optimiser can stop in a local optimum, which is why the other methods
run too and the best flown result is kept. A point-mass model for site comparison and pre-study, not a
substitute for a launcher's own certified flight analysis.
Payload, trajectory and drop zones, site by site
Run it on your own vehicle and your own candidate sites, then carry the figures into a full
launch-site comparison and its PDF study.